R is a very powerful, flexible, open-source statistical programming language which is really good for parsing and analysing datasets.
I've written some R code to parse .gpx files, analyze the data and generate .pdf reports. You just put the script into a directory, together with the .gpx file to be analyzed (which you can access by clicking the export button on the page for any of these activities for example), add the filename to the top of the script, and run it. A .pdf report like this one is generated.
The reports contain several types of plot, including the following four types:

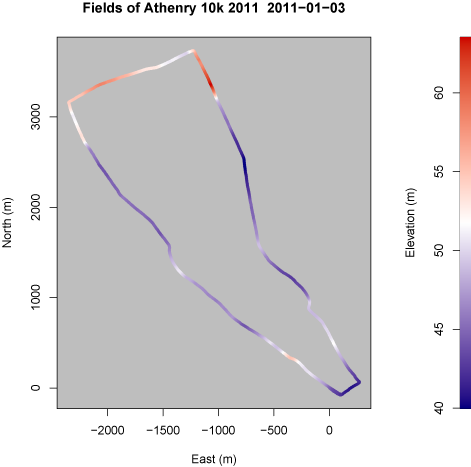
Elevation varying along route followed. Colour indicates elevation, x and y coordinates represent distance from the starting point in a northerly and easterly direction respectively.

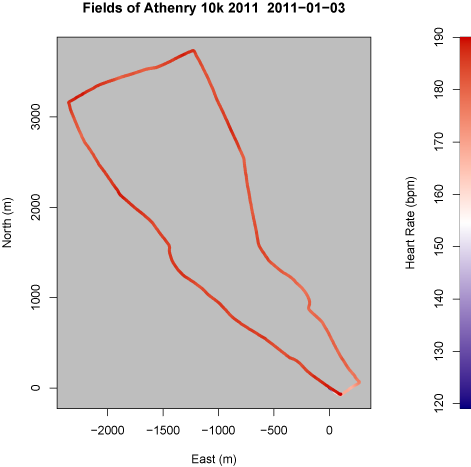
Heart rate varying along route followed. Colour indicates heart rate, x and y coordinates represent distance from the starting point in a northerly and easterly direction respectively.

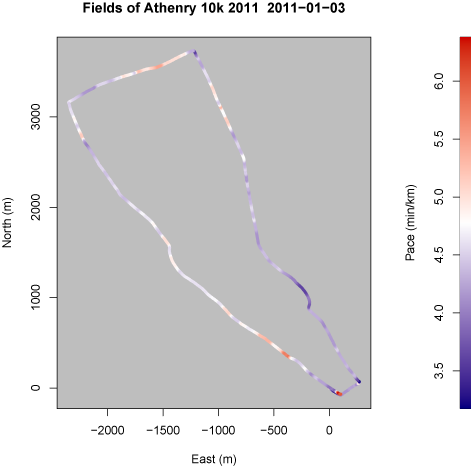
Pace varying along route followed. Colour indicates pace, x and y coordinates represent distance from the starting point in a northerly and easterly direction respectively.

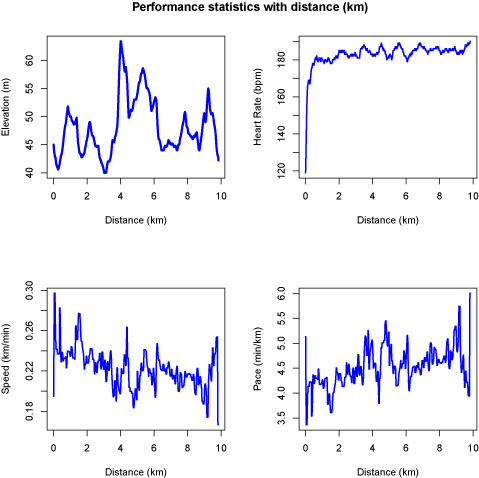
Elevation, heart rate, speed and pace varying with distance covered along route.
The R code is effective but untidy. I had intended to write it nicely into S3 classes or even an R package, as I think that others might be interested in using it, but I have run out of steam a bit. If anyone is interested in it, let me know as this would give me some motivation!
Here are some other reports I've generated. The first four runs are along essentially the same route and are comparable.
- A run with Peter
- A run with Peter
- A run with Peter
- A run with Peter and David
- A 10k race
- A short run on my own
- A longer run on my own
- A run before the race
- Squash with Cesar and some sprints - to compare difficulty of squash and running
