I've run the race this year in January 2011, (45.01 (135th)), it was postponed from St Steven's day 2010) and in December 2008 (44.26 (150th)). To complement the data I captured during the race, there are two more interesting datasets which are the finishing times for participants for these two years (available for 2008 here and for Jan 2011 here).
This year, I ran more slowly than I would have liked. I have a bucket of excuses (couldn't train in weeks leading up to race because of bastard snow and ice in Newcastle, got flu in weeks before race, over-trained just before race in attempt to compensate) but what I thought I would like to do is demonstrate statistically that my time wasn't as bad as all that. While attempting to show that everyone ran slower this year than in 2008 (they didn't) I wrote some R code to do the analysis, which I thought might be useful for demonstrating one of the strengths of R: reading in data.
Similar to Python, R has some functions for painlessly reading in text files. This makes idle mucking about with data much more likely to happen, since it doesn't involve building complicated functions to parse files first. These two finish times datasets are good examples of real data, they are formatted in non-standard ways, they have gaps, empty records, empty columns, timestamp formatting to deal with. The code got a bit too complicated for a simple demonstration of how to deal with data in R, but it is well commented and it is a good example of data handling, you can have a look at it here. The datasets to make the code run are also here and here.
Density Plots: detailed look at finishing time distributions
This is a density plot of the finishing times for all participants for both
years I raced. My times are marked with vertical dashed lines.
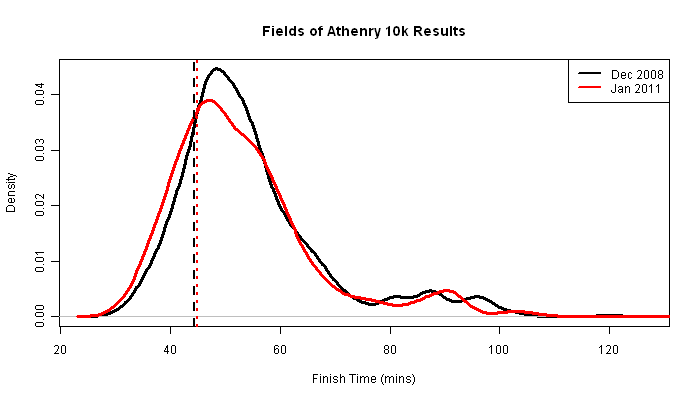
I had hoped to demonstrate that everyone was slower in 2011, however, comparing these distributions using the Mann-Whitney (or Wilcoxon) test yields no evidence for a significant difference in medians (p-value 0.097). This test is more appropriate than a t-test because the data are clearly non-normal (asymmetric and bimodal). Blindly using a t-test regardless gives the same result, but with a larger p-value (0.49).
Instead of inspecting these differences visually by comparing the distributions above, we can generate some summary statistics for the two datasets:
   # Summary Statistics December 2008

   Min. 1st Qu.  Median    Mean 3rd Qu.    Max.

  30.67   46.12   51.48   54.61   59.08  120.00


   # Summary Statistics January 2011

   Min. 1st Qu.  Median    Mean 3rd Qu.    Max.

  31.20   44.48   51.05   55.26   58.78  195.60
In 2008 my time was around the 19.5% centile and in 2011, around the 27.5% centile. Too depressing to figure out of this difference is significant (I suspect it is).
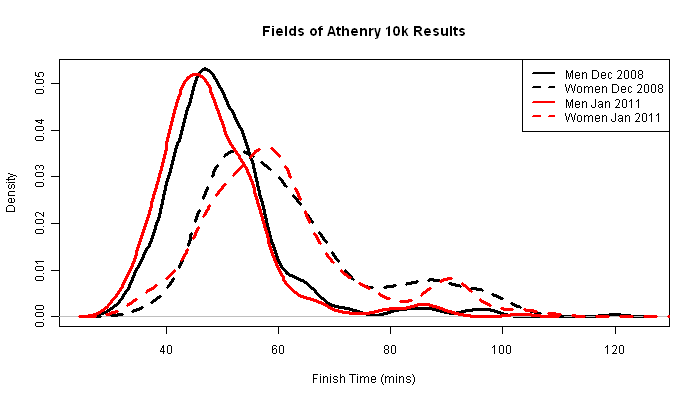
Besides trying to justify my slower time, there are other interesting comparisons which can be drawn using these data. The following plot shows both the male and female finishing time distributions for both years.
Here are the summary statistics for each of these categories:
  # Male December 2008

   Min. 1st Qu.  Median    Mean 3rd Qu.    Max.

  30.67   44.09   48.60   50.13   53.97  120.00

  # Female December 2008

   Min. 1st Qu.  Median    Mean 3rd Qu.    Max.

  36.88   51.08   57.75   61.75   67.96  102.70

  # Male January 2011

   Min. 1st Qu.  Median    Mean 3rd Qu.    Max.

  31.20   42.16   46.87   48.42   52.70  103.30

  # Female January 2011

   Min. 1st Qu.  Median    Mean 3rd Qu.    Max.

  35.87   51.50   58.67   65.41   67.34  195.60
Again we can test for significant differences with the Mann-Whitney test, and find that in 2008 the median finishing time for men was significantly faster than that for women (between 8.2 and 11.16 mins faster). In 2011 this was again significant and between 6.7 and 10.3 mins faster. More surprisingly we can show that the median finishing time for men in 2011 was between 0.5 and 2.7 mins faster than that for 2008, and was significant. Similarly for women it was between 0.35 and 5 mins faster.
Boxplots: visually comparing many distributions
There are still further levels of detail in this dataset, we can break down each sex by age category and look at distributions within each category, for instance comparing junior men (MJ <18) with senior men (MS 18-40) and men between 60 and 65 (M60). We can even begin to speculate whether we can see evidence for (and even quantify) age-related physical deterioration.
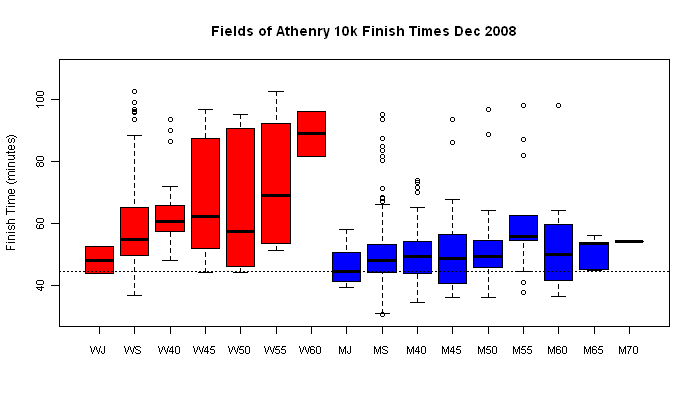
I've plotted my finish time as a horizontal dashed line in these boxplots. You can see that plenty of senior women, men over 60 and junior men beat me.
We can plot the same data for both sexes side by side, matched by age:
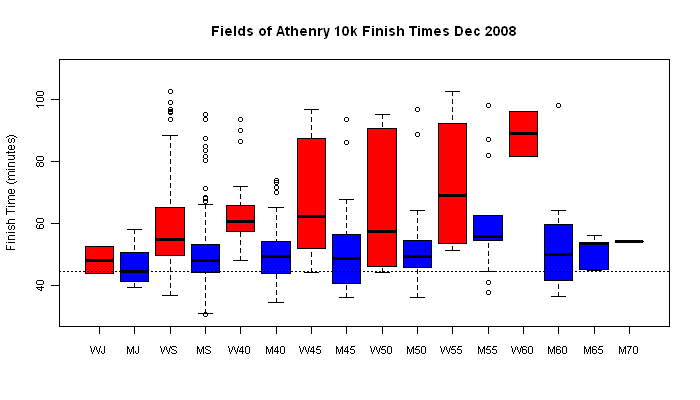
I was surprised at how well the M60 and M45 categories fared compared to their younger competitors. The M60 category in particular would be my father's category if he were to race! Several of those guys beat me well. This is not really how ageing is supposed to work. I was also surprised at how closely matched the WJ and MJ categories were.
The equivalent of these last two plots for 2011 can be found here and here. The surprising observations are consistent across the two years.
I am now interested to know why does the M60 category perform so well? Is it because people who are still running at age 60 have been running all their lives and have self-selected themselves to be good runners? My colleague Peter Banks believes that older runners have less competition for their time (children grown up, possibly retired) and can train more effectively. Also, 10k running requires quite long-term training to build up the necessary stamina to get a good time. Maybe there's hope for me to improve yet (hopefully before I'm 60).