Conor Lawless
Scientific Computing
data science, dynamic simulation modelling, genomics, interactive visualisation, dashboards, engineering design, image & video analysis
e: cnr.lwlss@gmail.com
About me
Exactly when do days begin and end?
If you live anywhere away from the equator, you’ll be familiar with the fact that days are short in winter and long in the summer. There’s even a slight effect at the equator, but the farther away from the equator (e.g. the farther north you live in Europe) the more extreme this effect is. At the poles, there is a period in the summertime when the sun never sets, and similarly in winter, there is a period when the sun never rises. I don’t want to attempt to explain why daylength varies with latitude and season, but I find myself thinking about it more than usual since my recent move northward to North Uist. In this post, I will quantify changes in daylength and show some dynamic, interactive plots to visualise them.
Before I moved house, I had heard a lot of discussion of how long the days were this far north. I looked up some sunrise and sunset times for the height of summer here and calculated that there was at most one hour’s difference in daylength between, my former home in Dunston and my current home North Uist. I guessed that this meant that it would get dark about a half an hour later, which didn’t seem much to me. However, now that the summer solstice is approaching, I am really beginning to notice that there is a lot of light up here, far more than the one hour’s difference seemed to suggest. I wanted to understand how this discrepancy came about.
Defining when the day ends
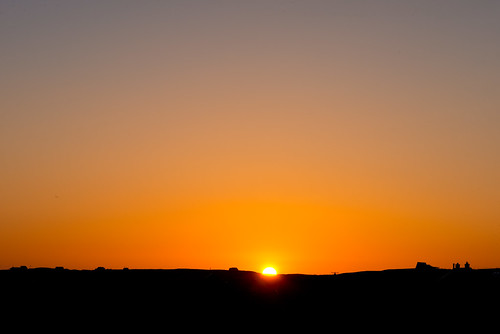
The standard definition of sunset is the time when the top of the sun dips below the horizon. The world doesn’t suddenly become dark when this happens! For some time after the sun first disappears completely below the horizon, its light reflects off the atmosphere. This period is called twilight, and there are several alternative definitions of when twilight ends. So, our definition of when the day is over is quite fuzzy. For some time after the sun dips below the horizon, there is enough light for a wide range of activities. I tend to think of the day being over when it’s no longer light enough to walk around outside comfortably without artificial light. This is typically well after sunset, as defined above, but how far does the sun go below the horizon before this happens?
Predicting when the day ends
From our knowledge of astronomy and geometry, it’s possible to write down very accurate mathematical models to estimate when sunset and sunrise occur at a given location on the earth’s surface on a given day. The Astronomy Answers website gives a detailed description of the calculations required to predict these events. Vladimir Agafonkin has written the necessary calculations in a small JavaScript library called suncalc which allows us to generate estimates within webpages. Here I’ll use the suncalc and d3 JavaScript libraries to draw some dynamic, interactive plots exploring differences in daylength variation between some places I’ve lived, as examples. All the plots on this page are automatically redrawn to suit the date at which they are viewed.
Three example locations in the UK & Ireland
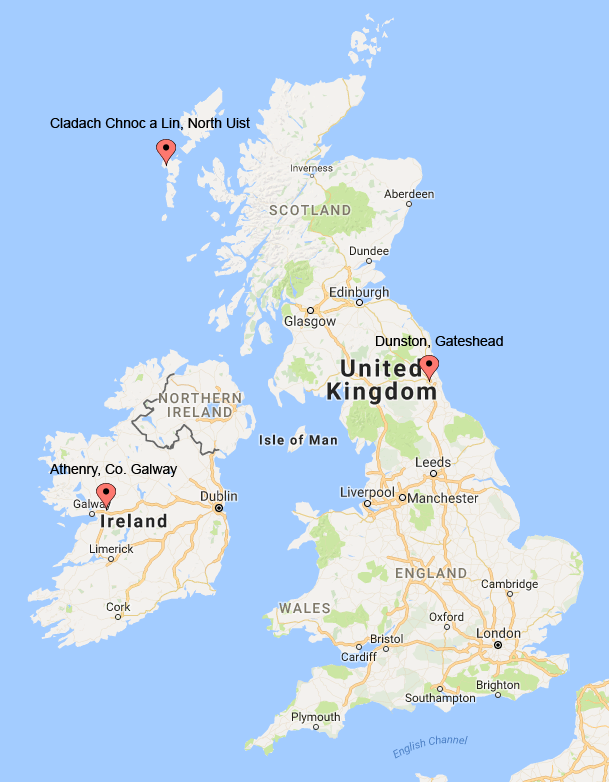
I’m originally from Athenry, Co. Galway in Ireland. Last year, I was living in Dunston, Gateshead in England and recently, I’ve moved to Cladach Chnoc a Lin, North Uist in Scotland. These places are all approximately at sea level. To calculate daylengths at these locations, I need their latitudes and longitudes. The easiest way to find these coordinates is to drop a pin on the appropriate location in Google maps (e.g. right-click a location and choose “What’s here?”).
Estimating sunlight phases with suncalc
Below is a very brief indication of how to write JavaScript code to use suncalc to estimate sunlight phases, given a location’s latitude and longitude. To generate plots showing how sunset time varies with date, you can first generate a list of dates and then use JavaScript’s map function to apply SunCalc.getTimes function below to that list and produce a corresponding list of sunset times.
// Add new angle beneath horizon to set used by getTimes
SunCalc.addTime(-8.3, "sunUp", "sunDown");
// Get today's date
var today = new Date();
// Calculate times of today's sunset, sunrise,
// end and beginning of twilight as defined by angle above
var sc = SunCalc.getTimes(today, lat = 57.58, lng=-7.42);
How does time at which day ends vary with angle below horizon?
The plot above shows, for the three example locations on , how the time at which we might declare the day over varies with angle below the horizon reached by the sun. If you hover your mouse over any of the three curves you should see exact predictions for the appropriate location and definition of end of day. Some standard definitions of the end of the day are highlighted as examples (Sunset, Dusk and Nautical dusk). I have also highlighted “Dark” as an angle that is roughly consistent with my definition of the end of a clear evening (-8.3°). If you find yourself at any of these three locations, you can check what angle corresponds to your definition of “end of day” by loading this page, noting the time at which you think day ends and then cross referencing the time on the y-axis with the corresponding angle on the x-axis. Interestingly, on the day I wrote this article, Nautical dusk is never achieved in North Uist.
How does time at which day ends vary with time of year?
Fixing the angle below the horizon that defines the end of the day at -8.3°, we can make a plot showing how the end of the day varies at the three example locations throughout the year. The sudden discontinuities in March & October occur because of Daylight Saving Time. We can see that since April, the end of the day has been getting later more rapidly in North Uist than in Dunston. We can also see that at the summer solstice (21st June) we expect the day to end about 1 hr 10 mins later in North Uist than in Dunston (hover mouse over curves for detailed times and dates).
How does the time at which day begins vary with time of year?
Assuming that the same angle below the horizon corresponds to the beginning of the day in the morning, we can generate an equivalent plot comparing the times at which the day starts at all the three locations (above). This plot is less symmetrical with the end-of-day plot than I would have imagined. For example, the beginning of the day only occurs about 40 minutes earlier in North Uist at the summer solstice.
How does daylength vary with time of year?
Finally, the plot above shows the variation of daylength with time of year. Here we can see that days are 22.37 h long in North Uist at the summer solstice, almost two hours longer than in Dunston on the same date.
Conclusion
The end and beginning of the day are not very clearly defined concepts. Although sunset and sunrise are clearly defined, they don’t really reflect our experience of “day”; it also includes twilight. The way the end of a day is perceived probably varies a little from person to person and varies a lot with the amount of cloud cover. It could be an interesting project to try to measure some of the variability in the times at which we declare days to be over. In any case, there’s a lot more daylight in North Uist in the summertime than in Gateshead!
These plots are redrawn, centred on today’s date, every time this page is opened. I will keep an eye on them throughout some of the long summer days to check whether they continue to reflect my experience of the day’s end and beginning.