Conor Lawless
Scientific Computing
data science, dynamic simulation modelling, genomics, interactive visualisation, dashboards, engineering design, image & video analysis
e: cnr.lwlss@gmail.com
About me
Mathematical art: tattoos & list-comprehensions
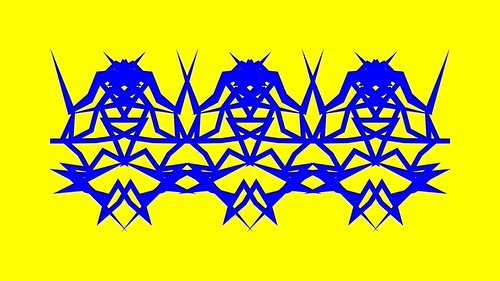
In 2007, as part of a series of collaborations with the visual artist James Johnson-Perkins, I made a video demonstrating the diversity of output possible from a fairly simple mathematical function (see function $t$ below). The video was displayed on large, external, urban screens in Derby, Nottingham and Leicester as part of the ‘Do billboards dream of electric sheep?’ exhibition. The shapes displayed in each of the frames of the video were generated by passing the frame number to a function like $t$:
The idea for this function came from a short article on mathematical art, written in the 1980s, which I have since lost, unfortunately. In that article, a mathematical expression similar to the right-hand side of the function above was used to generate a shape that was surprisingly complicated and ordered. I noticed that the expression could be generalised to form a wide range of similar shapes. The more general function above takes a pair of integers as input (the function’s arguments, $\theta$ and $p$), and returns a list of complex numbers as output. To visualise the function’s output we can draw tattoo-like structures by treating the Real and Imaginary parts of the complex numbers in the list as x & y coordinates on a flat plane, drawing lines between points as they appear in the list. This type of 2D visual representation of complex numbers is called an Argand diagram.
I recently noticed that a further, slight adaptation to this function could make output images more symmetric for all integer values. I have already updated the function as written above.
The function $t$ is a list-comprehension: a mathematical expression which uses set-building notation to represent instructions for building a list. List comprehensions are used a lot in modern scientific programming.
Many of the shapes resulting from plotting the output from this function are “closed”: the final point and the first point are the same, giving interesting cyclical patterns with either 2-fold or 3-fold symmetry. However, this pleasing, closed property seems to occur most often when $p=3$. In principle, $\theta$ can be any positive integer ($\theta=0$ results in division by zero, $-\theta$ results in the same shape as $\theta$). $\theta=1$ and $\theta=2$ result in lists of points lying along a straight line, (although the shape from $\theta = 2$ is closed). $\theta = 3$ results in an equilateral triangle (closed). From that point on, I don’t think that the resulting shapes have names.
I plan to write a few posts using the evaluation of $t$ and visualisation of its output as an example for comparing a range of different programming languages like R, Python, Julia and Haskell. I hope it will be a useful example for the following reasons:
- $t$ is a relatively simple function and it should be possible to write simple code to evaluate it
- $t$ produces output whose complexity can be evaluated immediately by visual inspection
- Despite its simplicity, in practise, evaluating $t(\theta,3)$ for very large values of $\theta$ (say, $\theta>2500$) is computationally expensive: it can take a long time or overwhelm your computer entirely.
- To explore a wide range of values of $\theta$ it will be more effective to use multiple CPUs during computation. For me, easy and efficient use of multiple CPUs is a critical feature of any scientific computing language.
Visualising output
The interactive figures below show tattoos drawn using two randomly generated values of $\theta$. Background and foreground colours are also generated randomly, according to the same psychedelic colour scheme that James and I used for the original video. Clicking the “Colours” button redraws the tattoo shapes with a new set of colours. Clicking the “Tattoos” button generates two new values for $\theta$ and uses them to draw a new pair of structures. Adjusting the slider varies the thickness of the line, which can hide or reveal detail in the underlying tattoo structures:
Tags: javascript vector graphics art mathematics maths complex numbers interactive visualisation list comprehension